
The S&P 500: Some Say It’s Overvalued, We Say Otherwise
A great number of pundits are calling the S&P 500 overvalued based on the PE Ratio (current price divided by earnings-per-share) when compared to historical levels. We, however, think it looks reasonably valued. This comparison could be made based on the trailing earnings or based on analyst expectations for next year’s earnings (forward) of the S&P 500. Most academic studies focus on the trailing earnings given the longer data set for actual past earnings than documented analyst expectations. Currently, the S&P 500’s trailing 12-month PE is 25.3x according to FactSet while the 10-year average is 20.4x and the average since year-end 1999 is 18.6x. When looking backward, the stock market does look a little overvalued, but not by anything crazy.
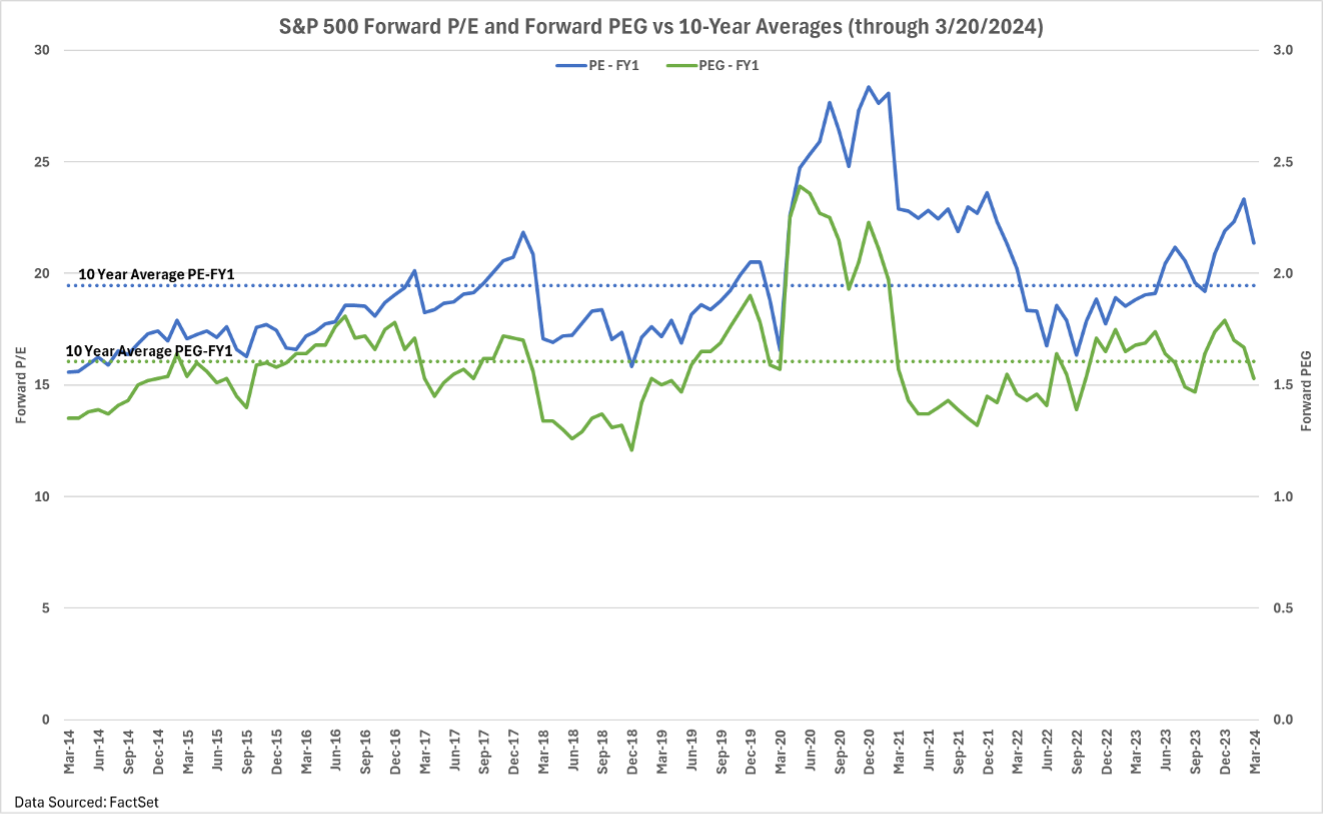
Since investors look toward the future, the Forward PE could be a better approach. According to FactSet, the Forward PE of the S&P 500 as of March 20, 2024, was 21.4x while the 10-year average was 19.5x and the average since year-end 1999 was 17.9x. This forward view still has the market a little overvalued, but not by that much.
Another valuation metric is the PEG Ratio, which starts with the PE Ratio and divides it by growth expectations. Essentially, what is the price compared to its growth prospects? As of 3/20/2024, FactSet has the S&P 500’s PEG at 1.5x while the 10-year average was 1.6x. By this measure, the market looks a little cheap.
Yet another valuation approach would be to review the Equal Weighted S&P 500 Index to see how the ‘average’ stock is valued by limiting the impact of the few mega-cap companies. This index’s Forward PE is only 17.1x, which is in line with the 10-year average of 17.0x. The PEG ratio is 1.7x compared to 1.8x over the last 10 years.
Based on multiple valuation approaches, the S&P 500 appears to be valued appropriately. Looking backward might imply a level of overvaluation, but that fails to consider the slowdown in earnings many companies had in 2023 and doesn’t factor in potential growth. The economy continues to be very resilient, and earnings are expected to rebound in 2024.